
Developers and operators on IT and development teams want powerful metric querying, analysis, charting, and alerting capabilities to troubleshoot outages, perform root cause analysis, create custom SLI / SLOs, reports and analytics, set up complex alert logic, and more. So today we’re excited to announce the General Availability of Monitoring Query Language (MQL) in Cloud Monitoring!
MQL represents a decade of learnings and improvements on Google’s internal metric query language. The same language that powers advanced querying for internal Google production users, is now available to Google Cloud users as well. For instance, you can use MQL to:
- Create ratio-based charts and alerts
- Perform time-shift analysis (compare metric data week over week, month over month, year over year, etc.)
- Apply mathematical, logical, table operations, and other functions to metrics
- Fetch, join, and aggregate over multiple metrics
- Select by arbitrary, rather than predefined, percentile values
- Create new labels to aggregate data by, using arbitrary string manipulations including regular expressions
Let’s take a look at how to access and use MQL from within Cloud Monitoring.
Getting started with MQL
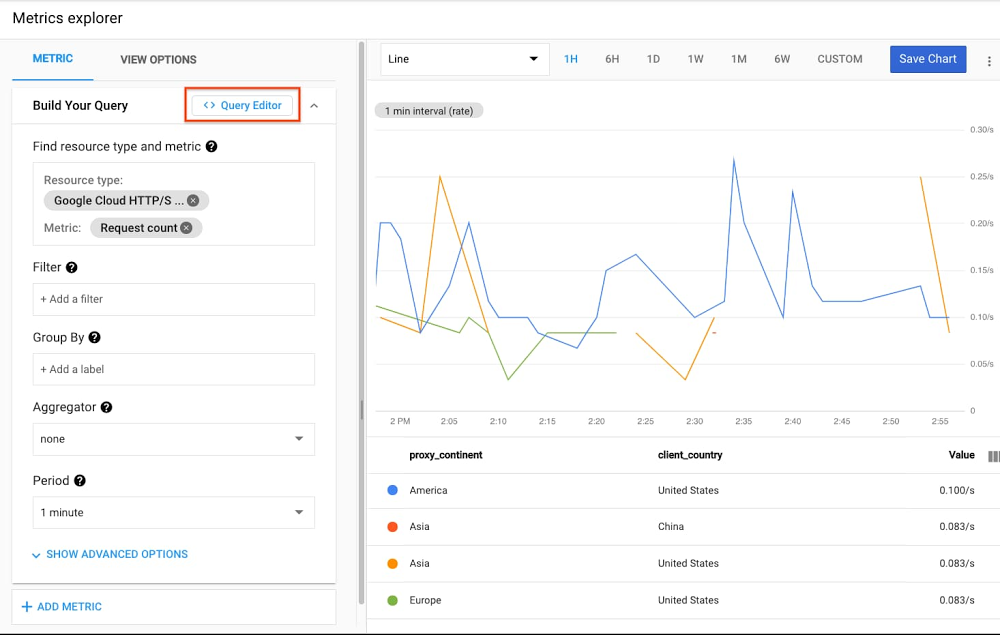
It’s easy to get started with MQL. To access the MQL Query Editor, just click on the button in Cloud Monitoring Metrics Explorer:
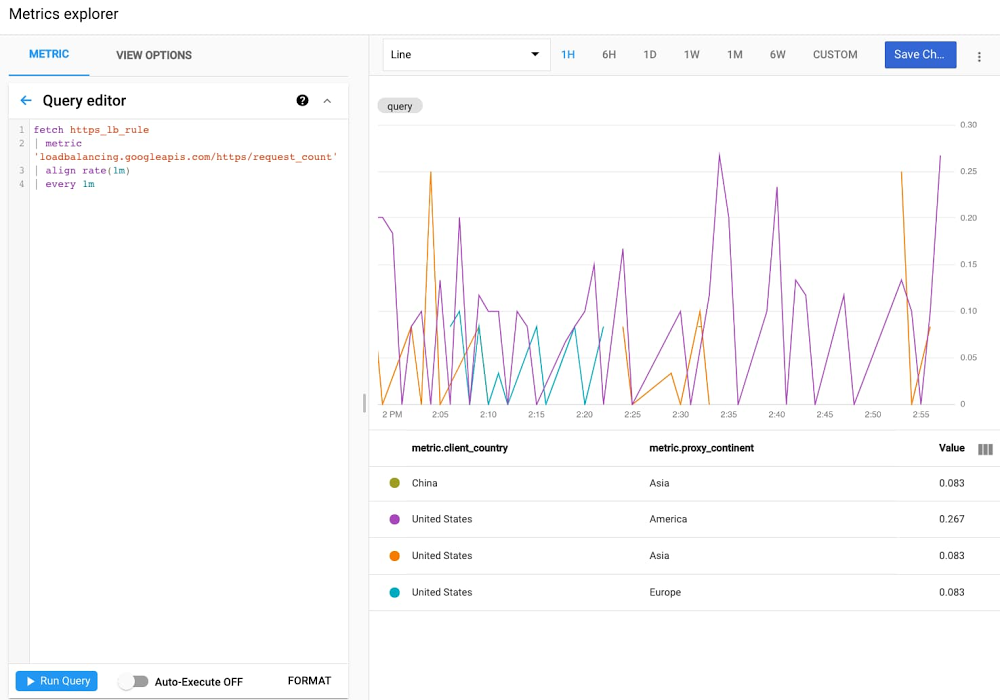
Then, create a query in the Metrics Explorer UI, and click the Query Editor button. This converts the existing query into an MQL query:
MQL is built using operations and functions. Operations are linked together using the common ‘pipe’ idiom, where the output of one operation becomes the input to the next. Linking operations makes it possible to build up complex queries incrementally. In the same way you would compose and chain commands and data via pipes on the Linux command line, you can fetch metrics and apply operations using MQL.
For a more advanced example, suppose you’ve built a distributed web service that runs on Compute Engine VM instances and uses Cloud Load Balancing, and you want to analyze error rate—one of the SRE “golden signals”.
You want to see a chart that displays the ratio of requests that return HTTP 500 responses (internal errors) to the total number of requests; that is, the request-failure ratio. The loadbalancing.googleapis.com/https/request_count metric type has a response_code_class label, which captures the class of response codes.
In this example, because the numerator and denominator for the ratio are derived from the same time series, you can also compute the ratio by grouping. The following query shows this approach:
fetch https_lb_rule::loadbalancing.googleapis.com/https/request_count| group_by [matched_url_path_rule],sum(if(response_code_class = 500, val(), 0)) / sum(val())
This query uses an aggregation expression built on the ratio of two sums:
- The first sum uses the if function to count 500-valued HTTP responses and a count of 0 for other HTTP response codes. The sum function computes the count of the requests that returned 500.
- The second sum adds up the counts for all requests, as represented by val().
The two sums are then divided, resulting in the ratio of 500 responses to all responses.
Now let’s say that we want to create an alert policy from this query. You can go to Alerting, click “Create Policy”, click “Add Condition”, and you’ll see the same “Query Editor” button you saw in Metrics Explorer.
You can use the same query as above, but with a condition operator that provides the threshold for the alert:
fetch https_lb_rule::loadbalancing.googleapis.com/https/request_count| group_by [matched_url_path_rule],sum(if(response_code_class = 500, val(), 0)) / sum(val())| condition val() > .50 '10^2.%'
The condition tests each data point in the aligned input table to determine whether the ratio value exceeds the threshold value of 50%. The string ’10^2.%’ specifies that the value should be used as a percentage.
In addition to ratios, another common use case for MQL is time shifting. For brevity, we won’t cover this in our blog post, but the example documentation walks you through performing week-over-week or month-over-month comparisons. This is particularly powerful when coupled with long-term retention of 24 months of custom and Prometheus metrics.
Take monitoring to the next level
The sky’s the limit for the use cases that MQL makes possible. Whether you need to perform joins, display arbitrary percentages, or make advanced calculations, we’re excited to make this available to all customers and we are interested to see how you will use MQL to solve your monitoring, alerting, and operations needs. To learn more about MQL, check out the documentation, quickstarts, examples (queries, alerts), a language and function reference, and more.